
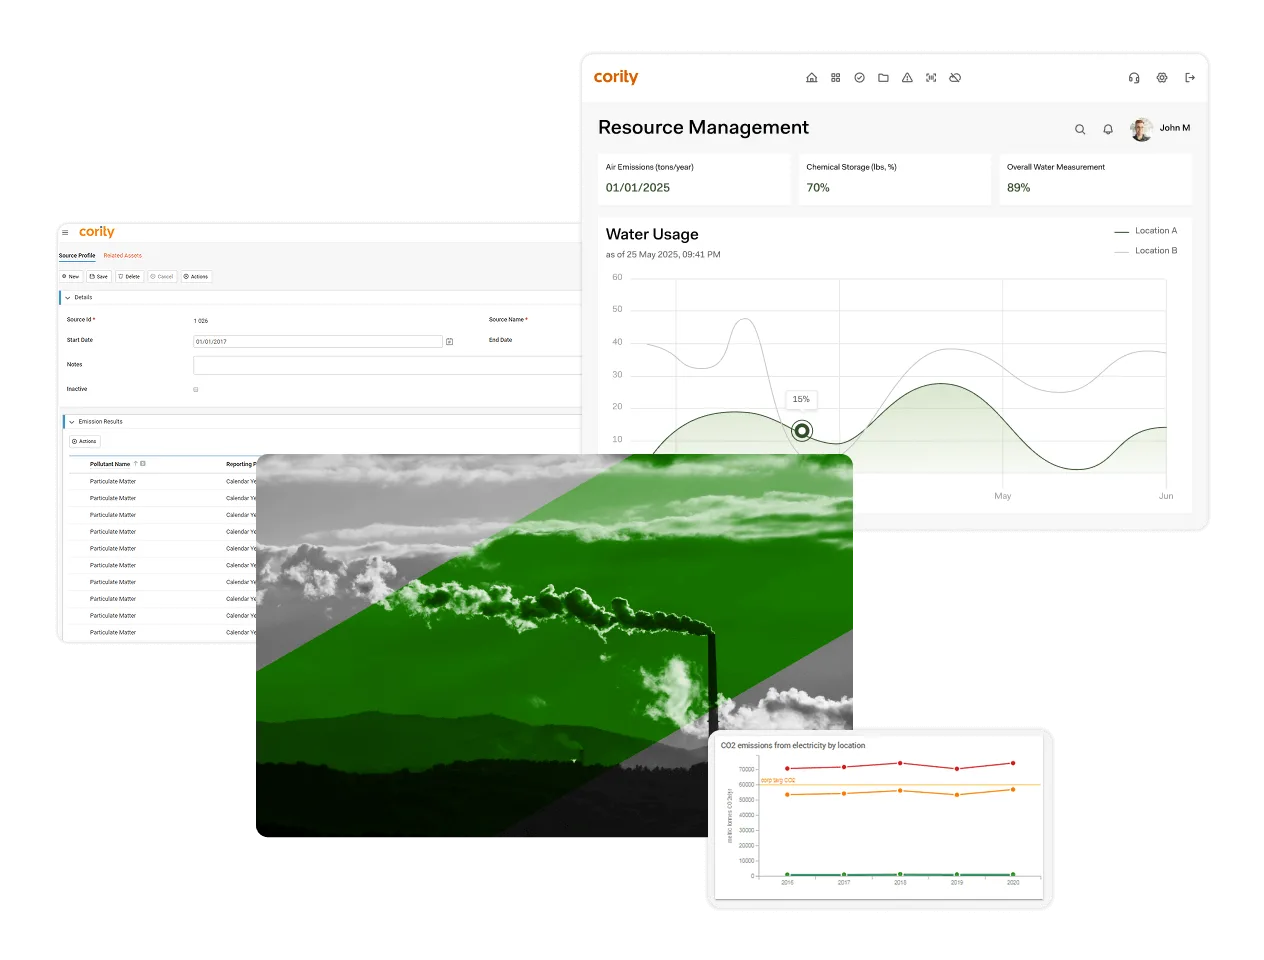


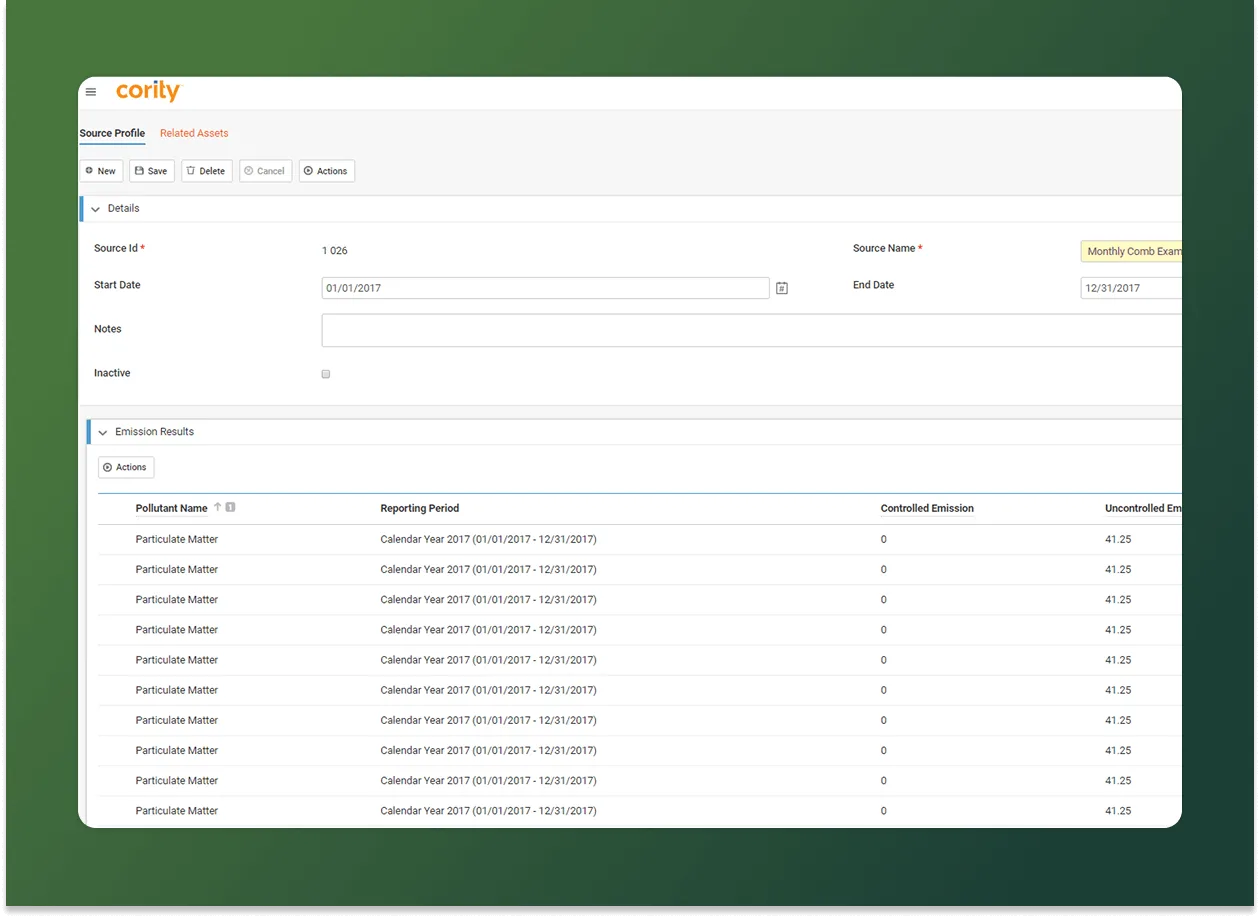
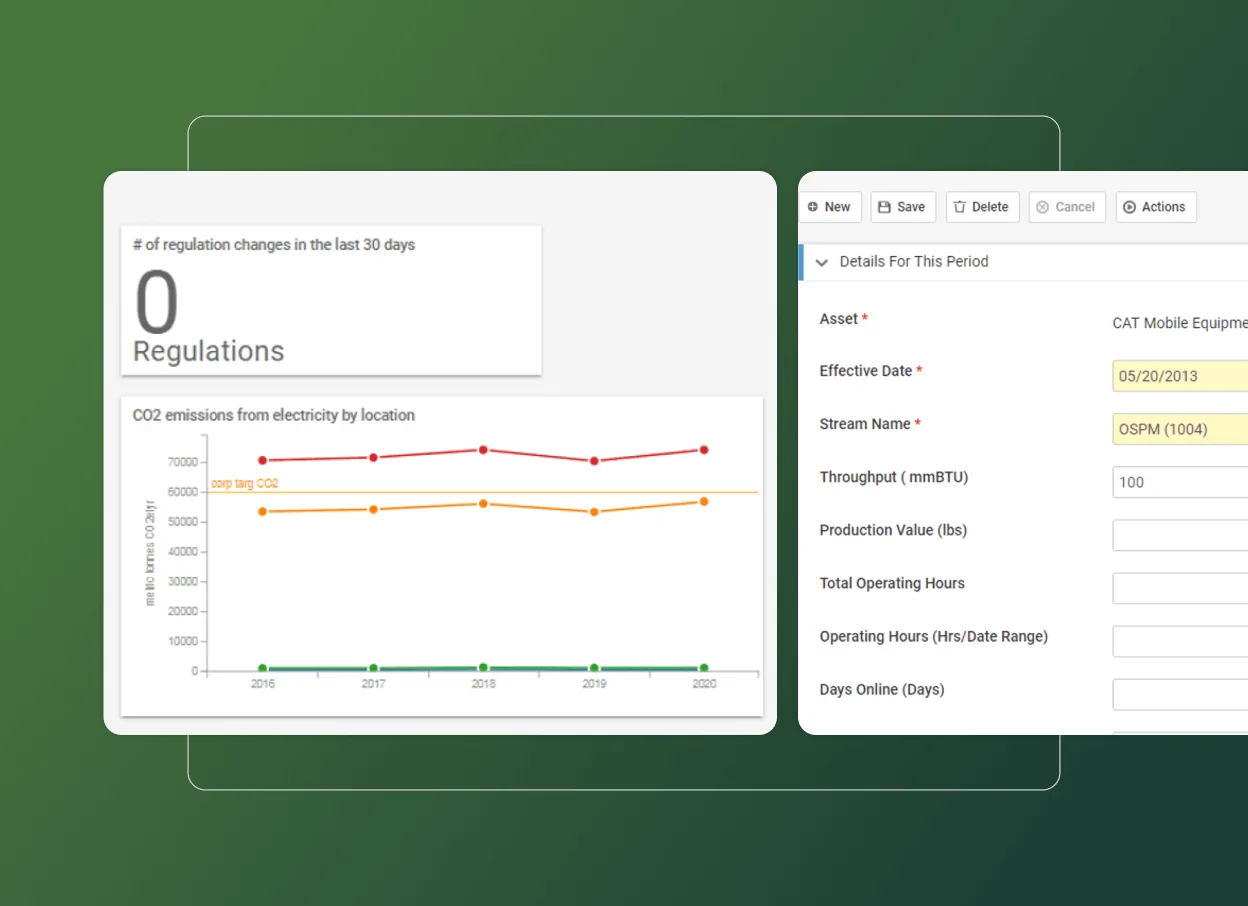
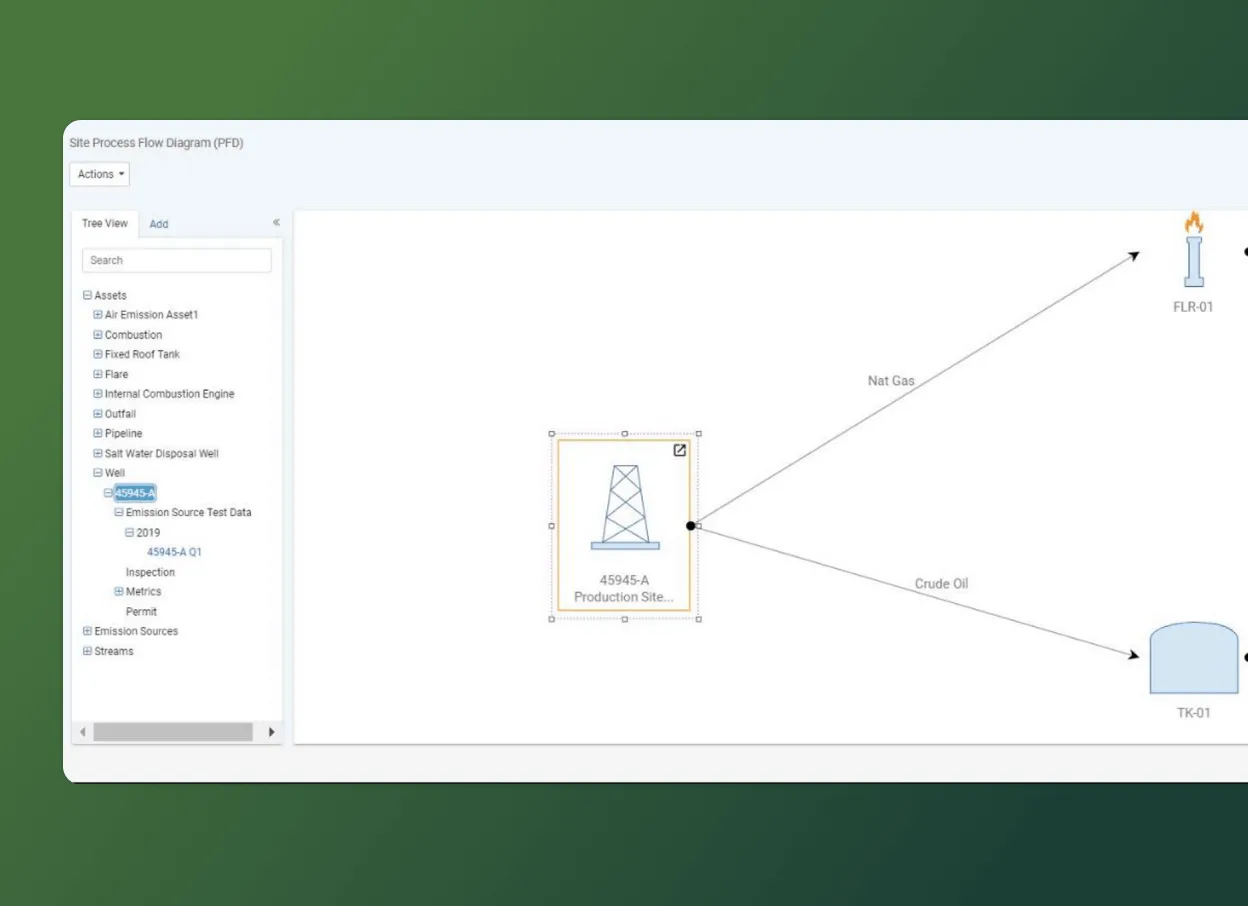
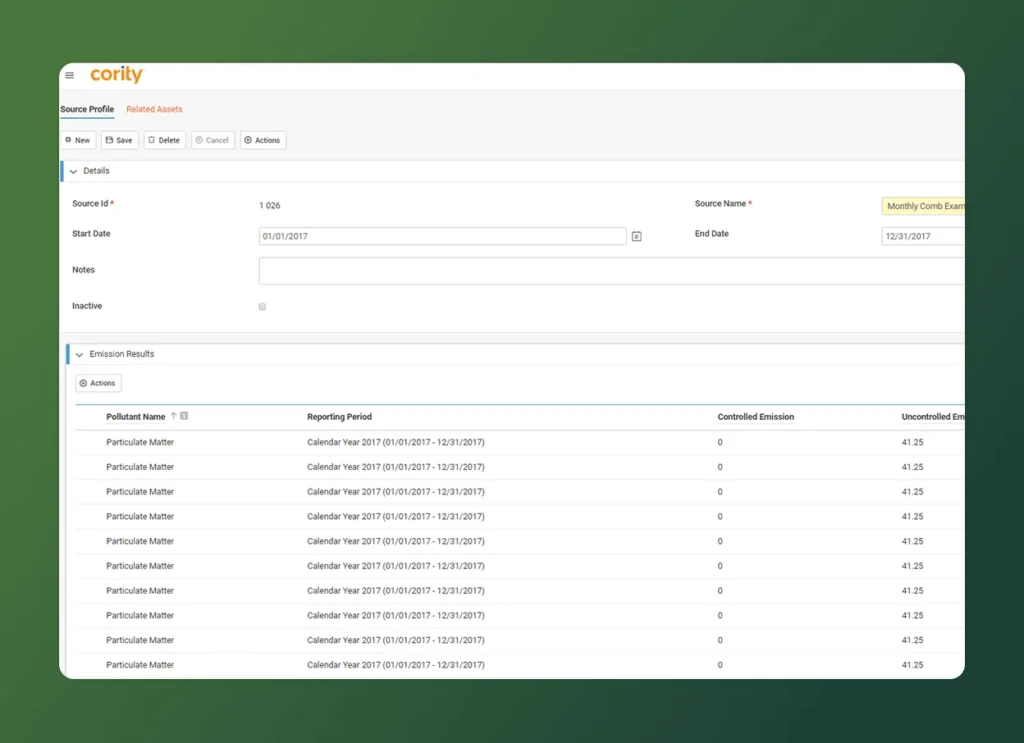
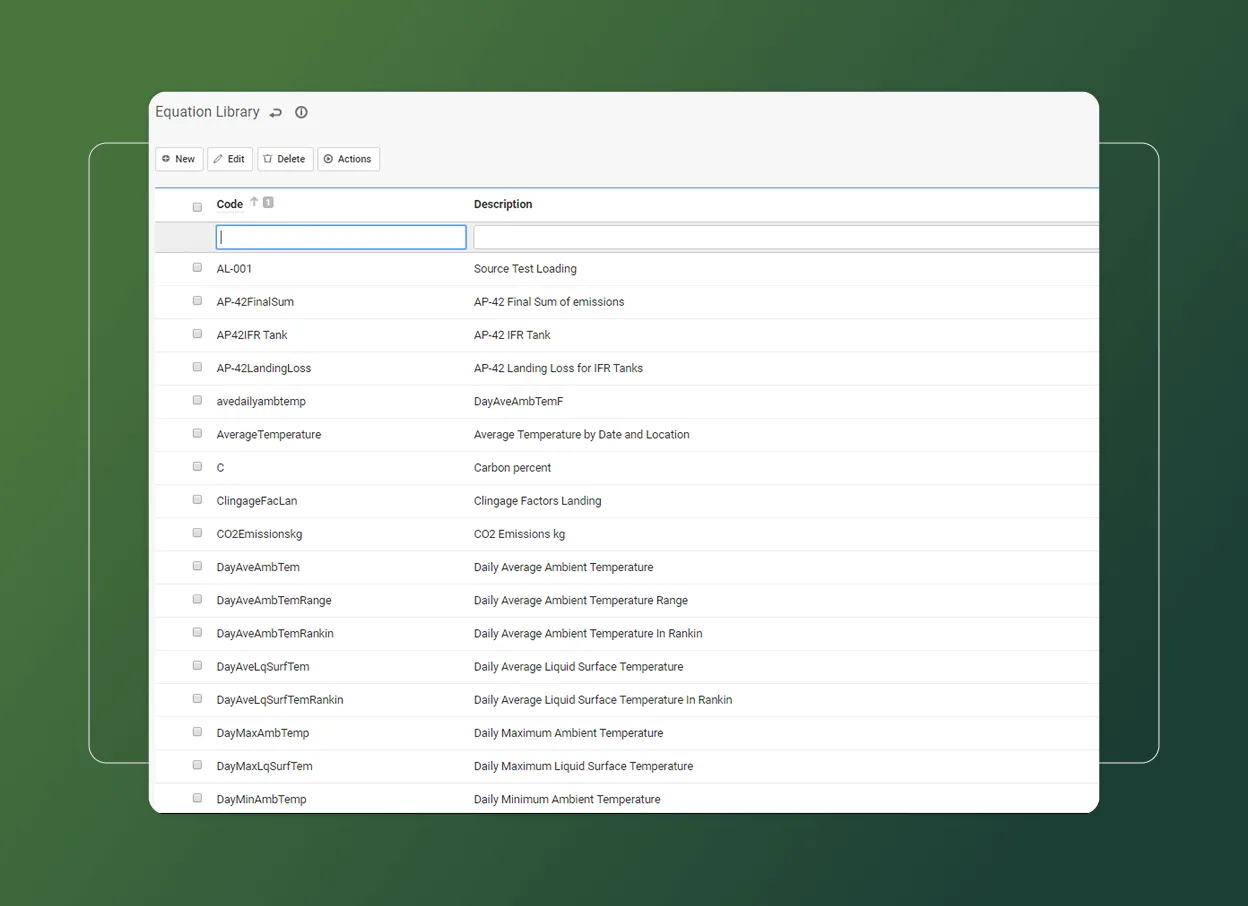
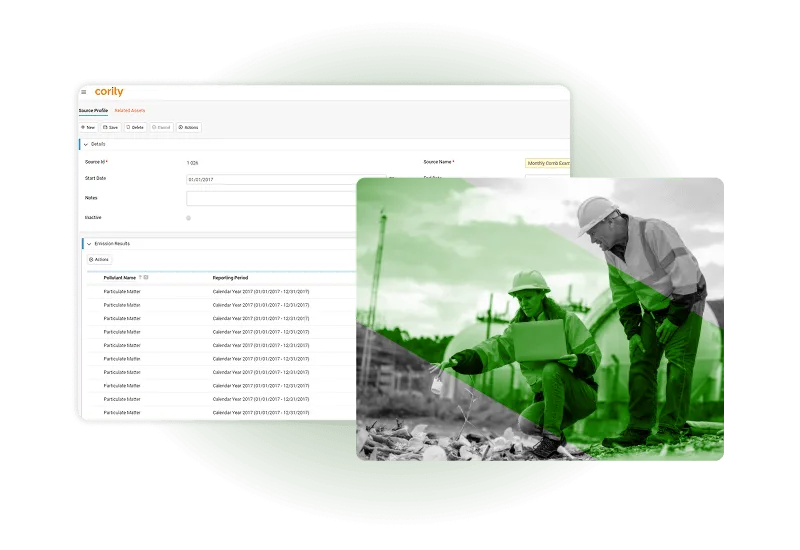
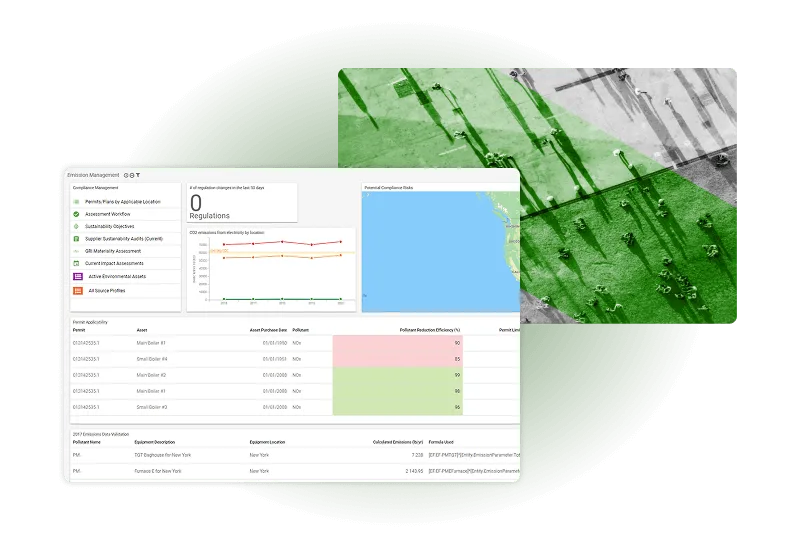
Simplify emissions reporting
Monitor real-time data
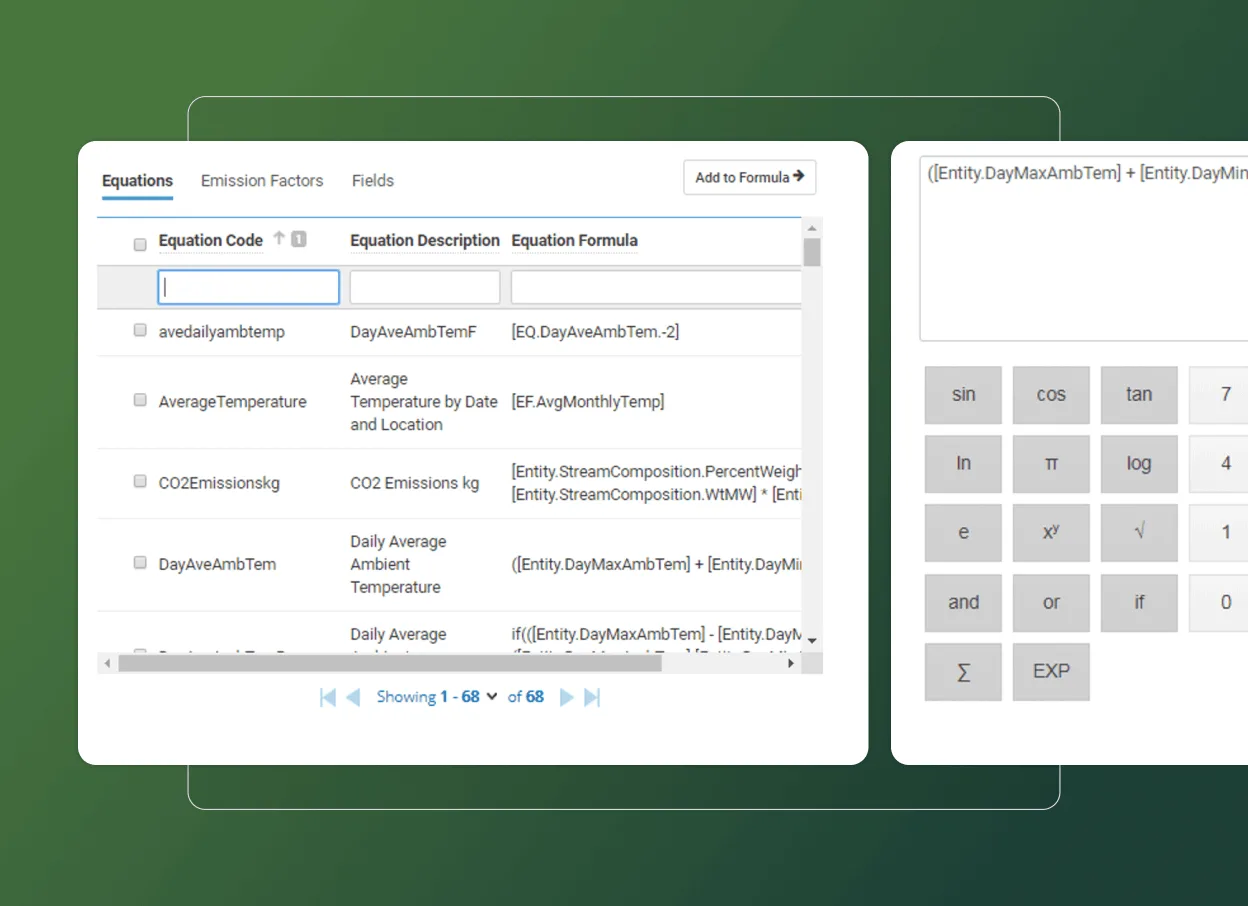
Automate calculations
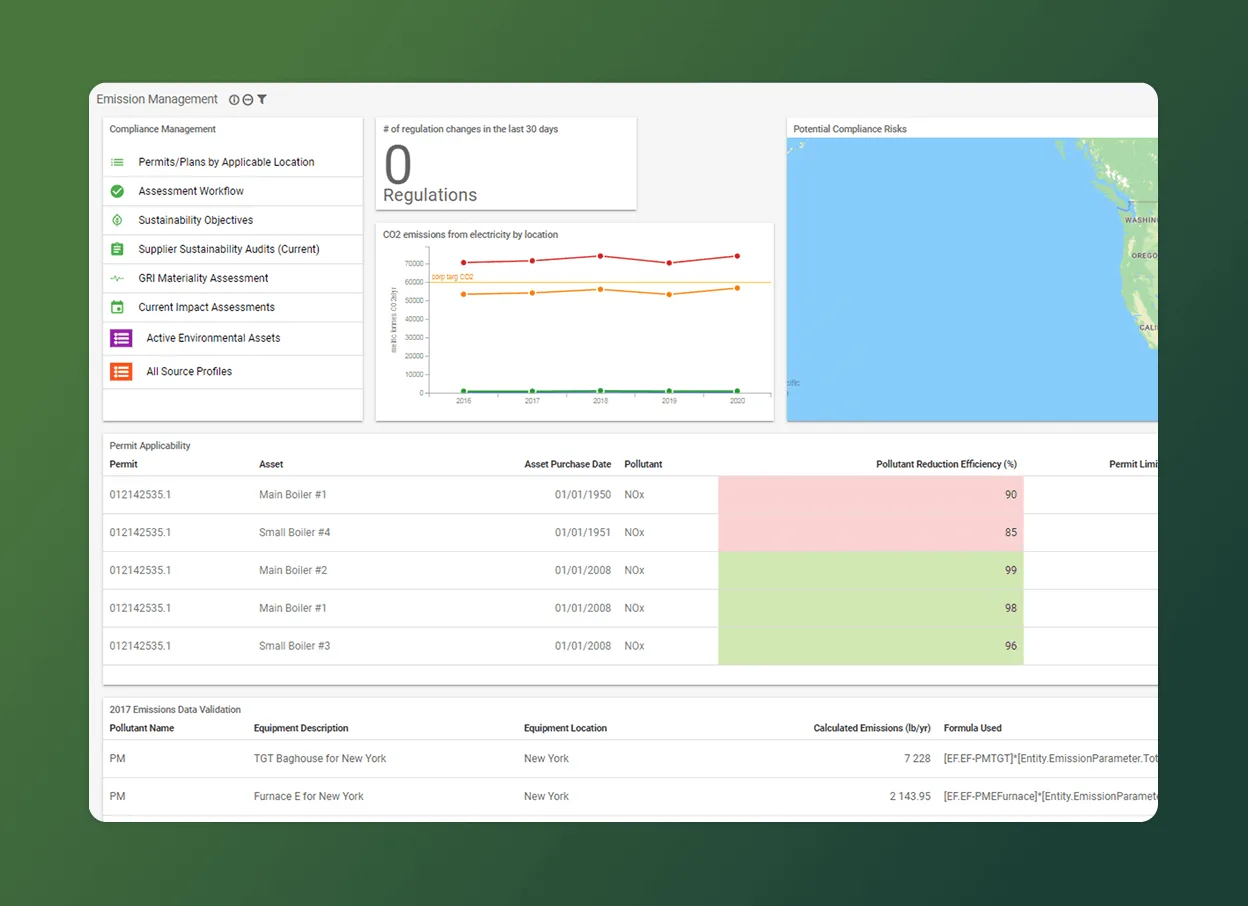
Compliance confidence
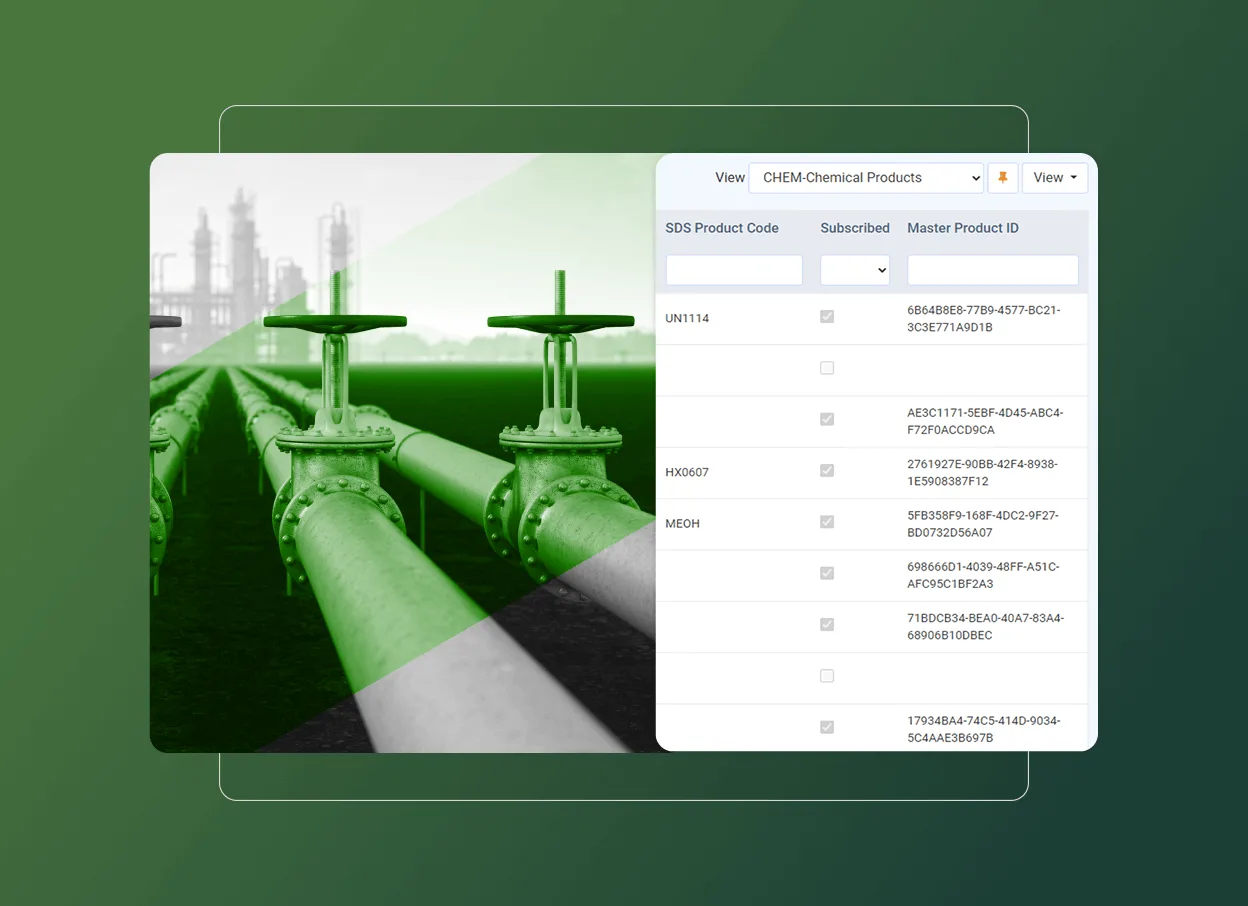
Manage chemical lifecycle
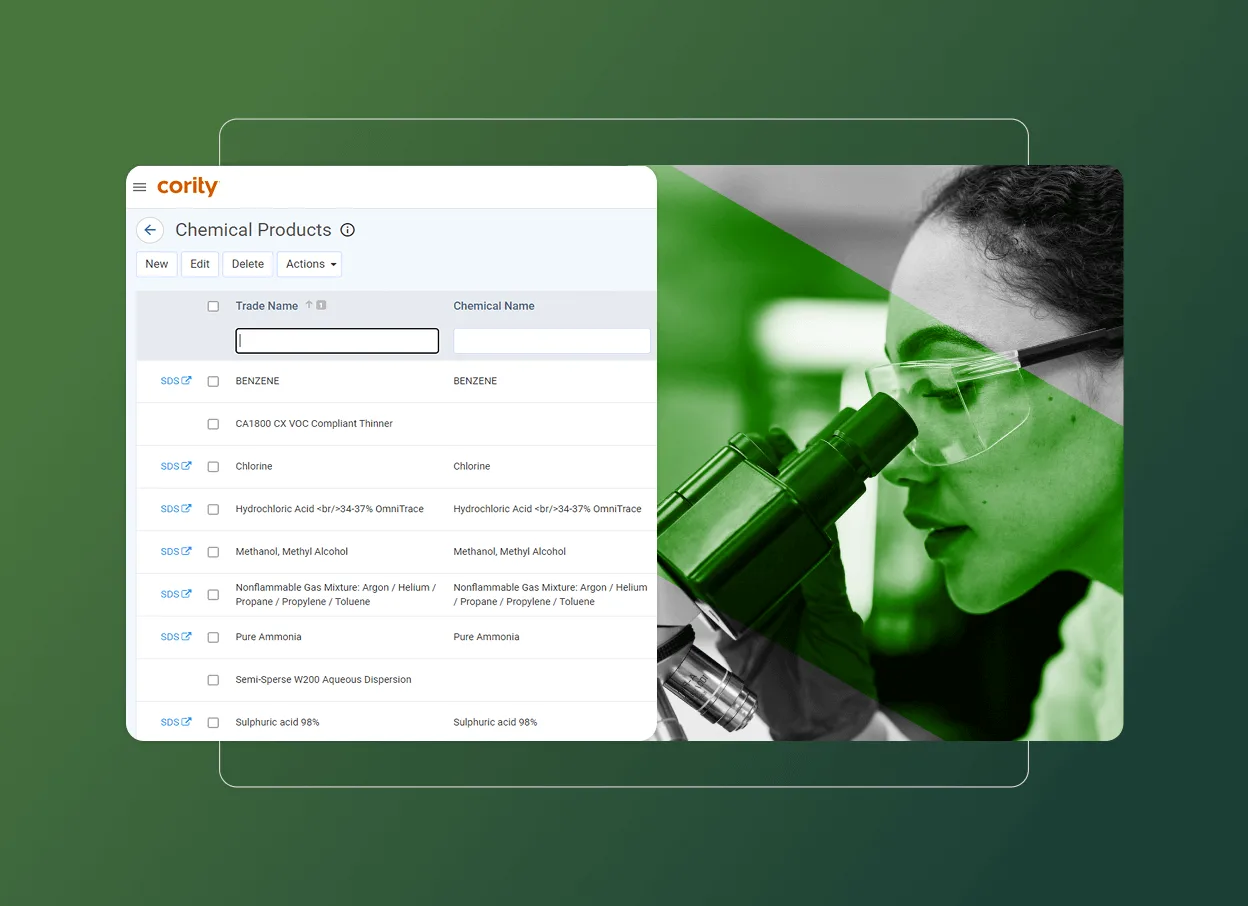
Reduce chemical risks
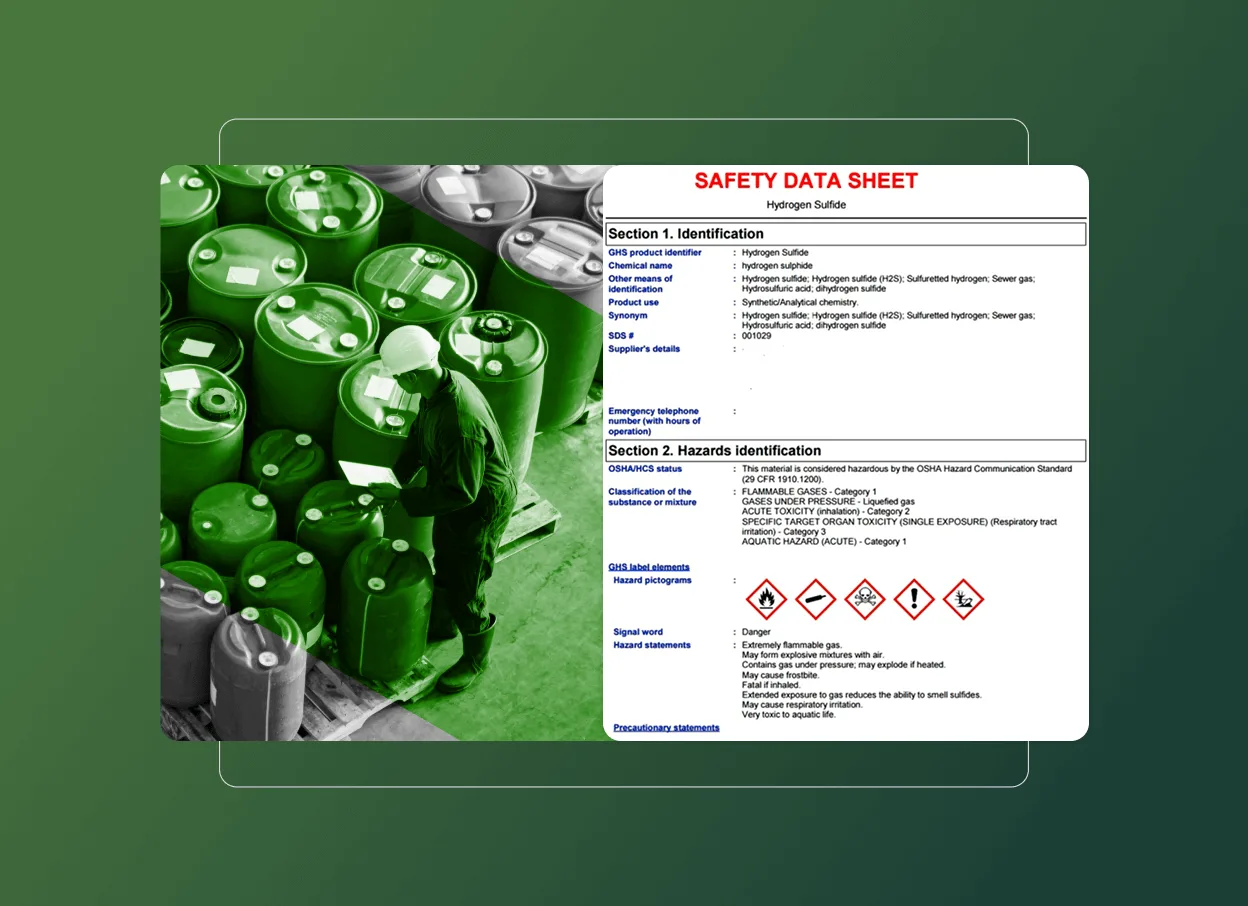
Improve compliance

Automate approvals
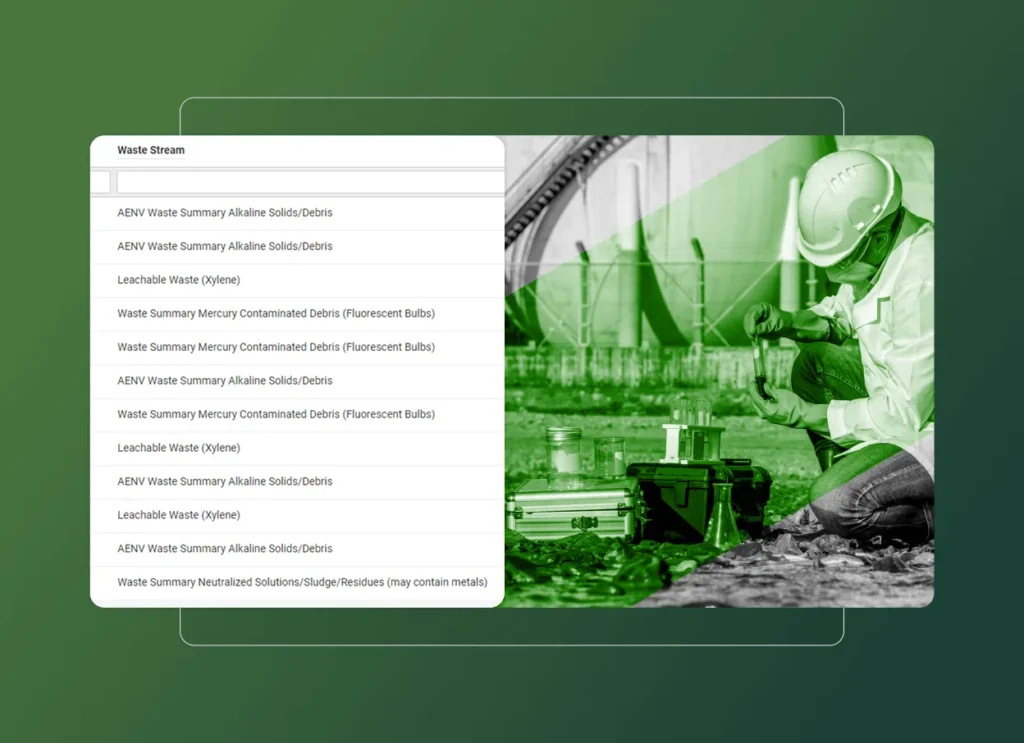
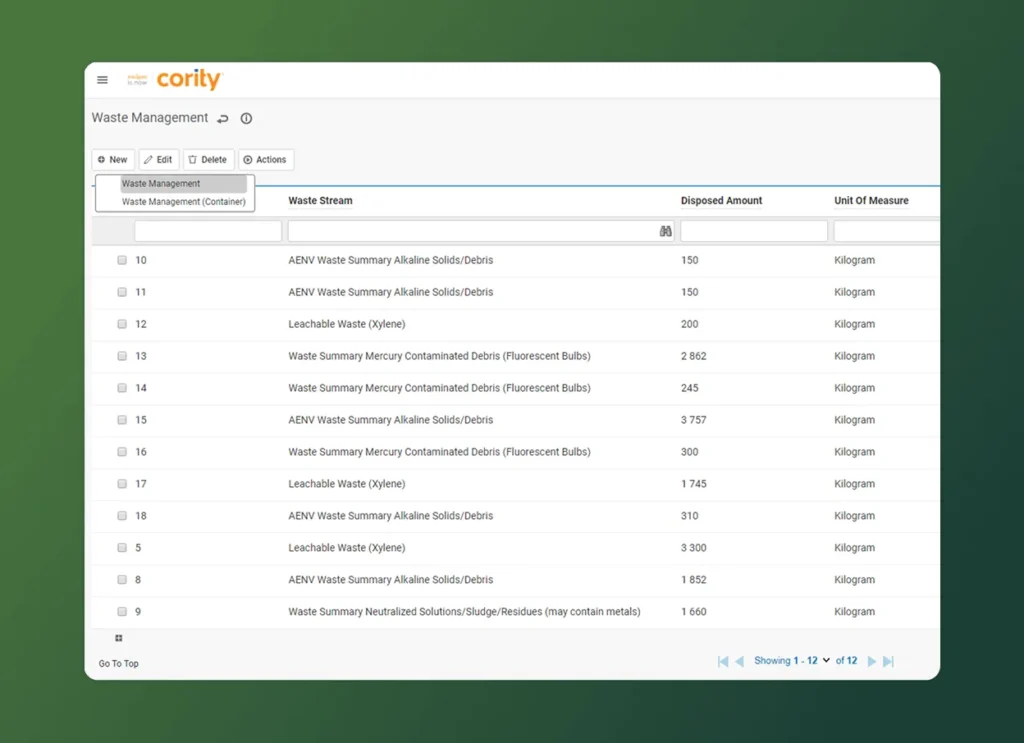
Track entire waste lifecycle
Optimize disposal costs
Automate waste reporting
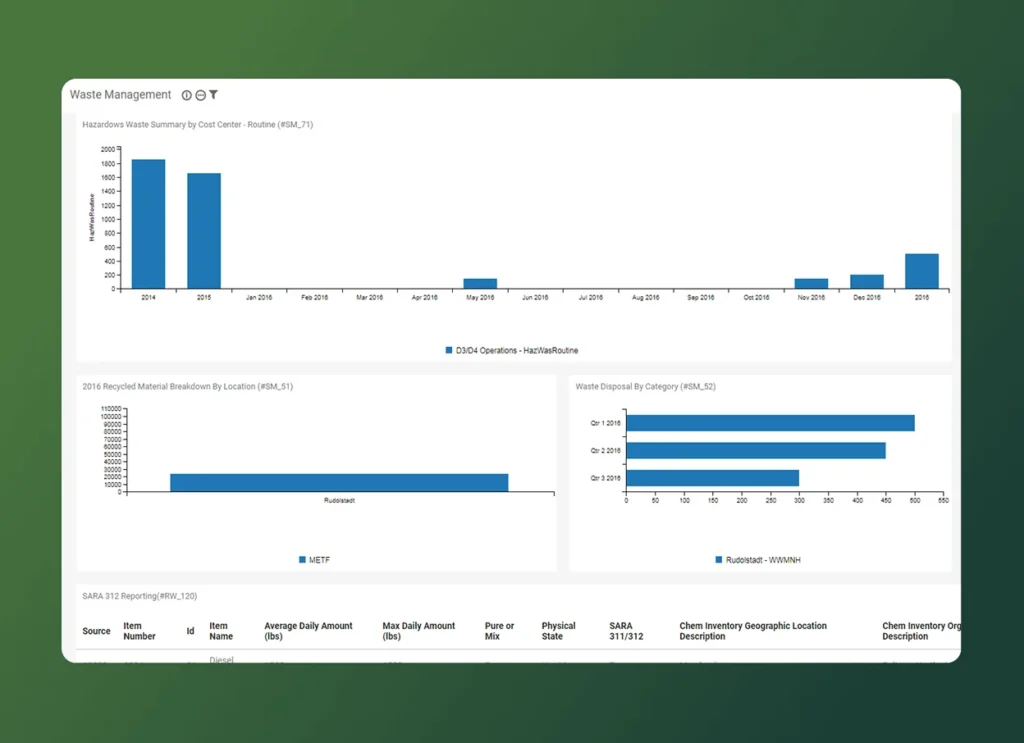
Improve compliance
Monitor water discharges
Analyze sampling data
Automate water reporting
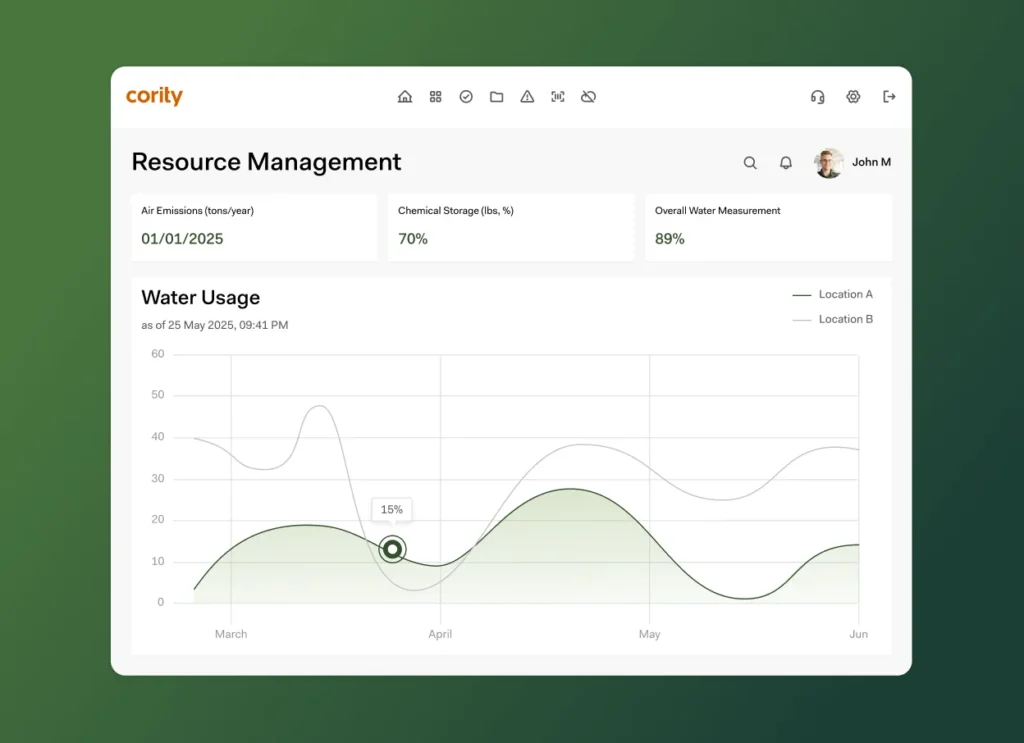
Improve sustainability
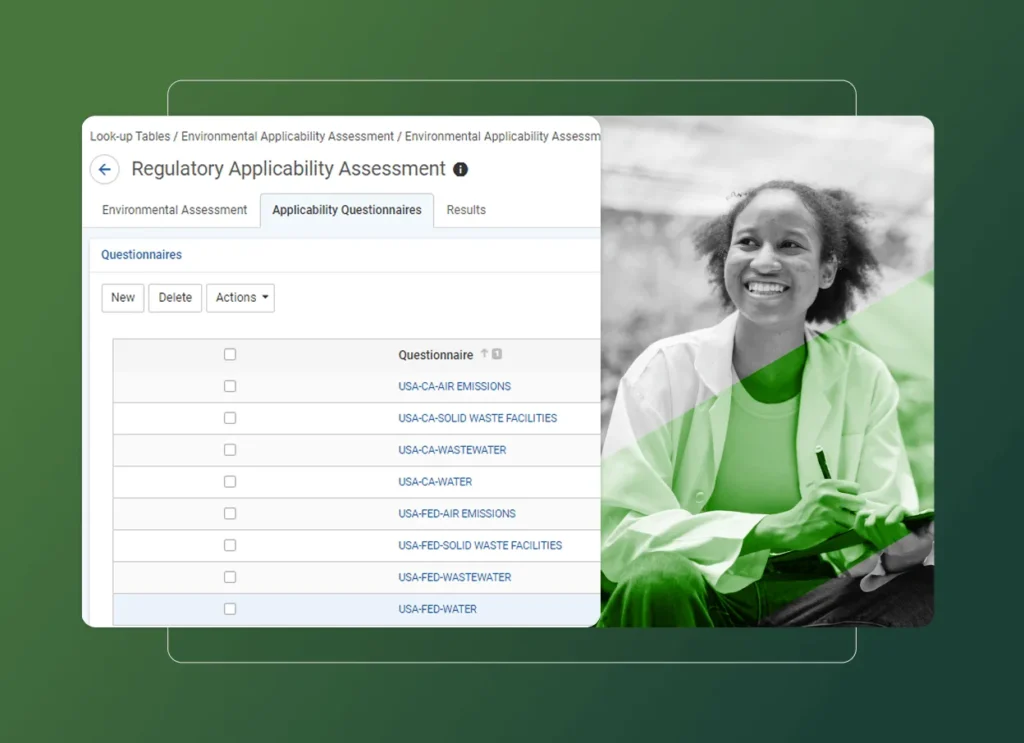
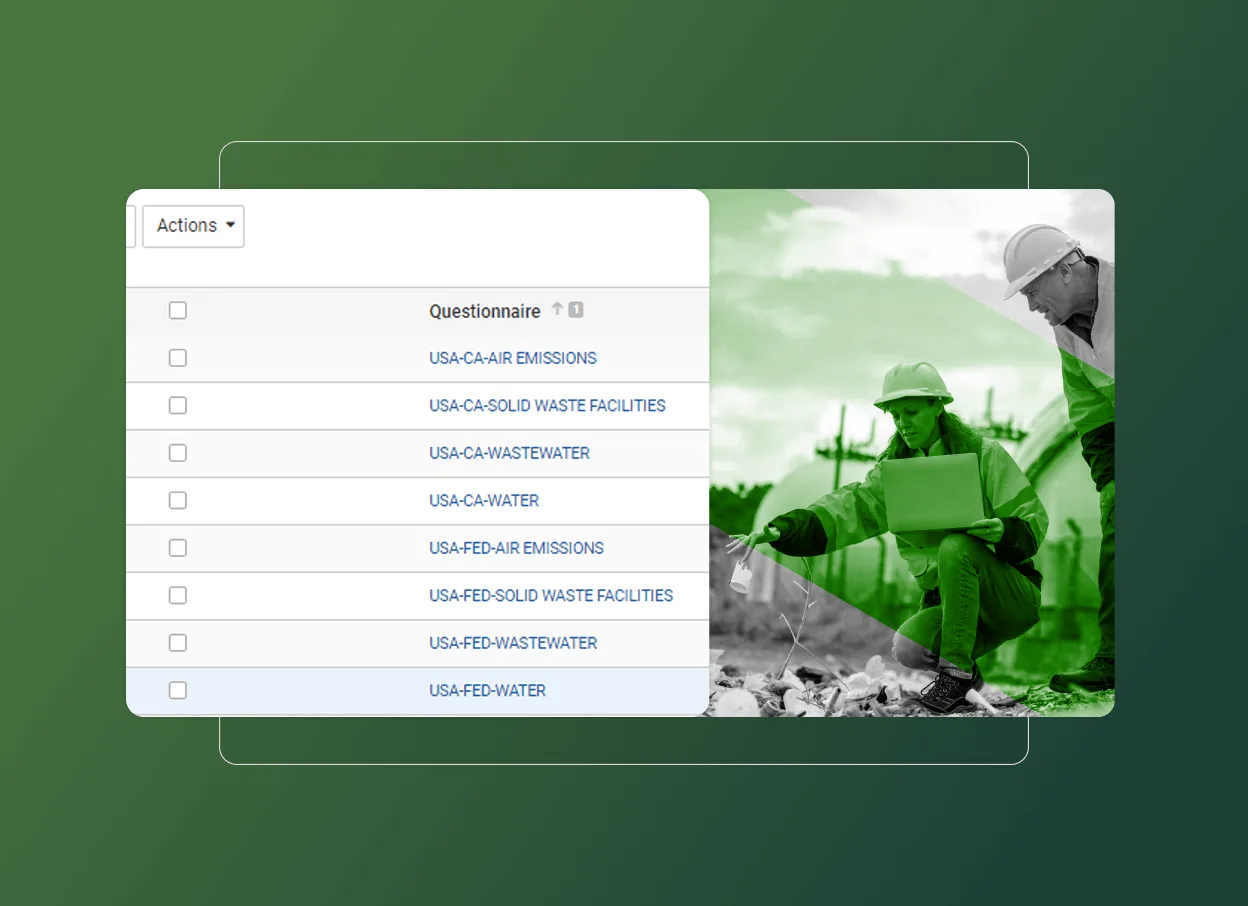
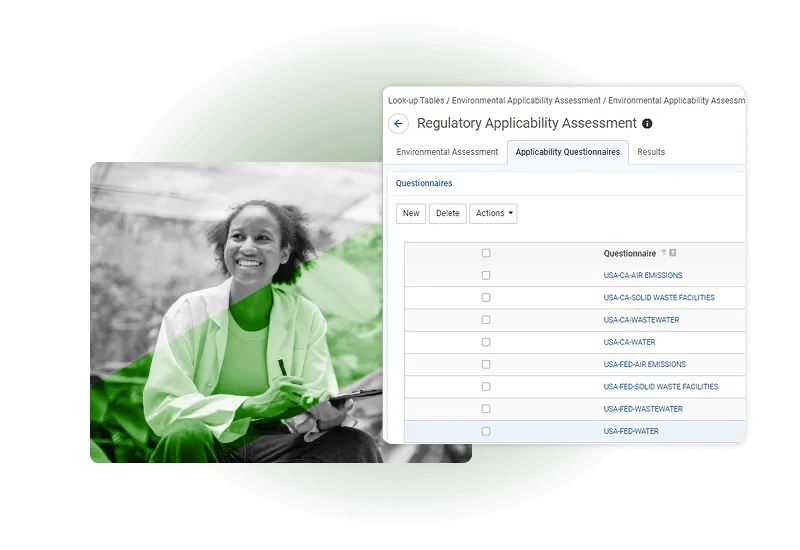
Standardize processes
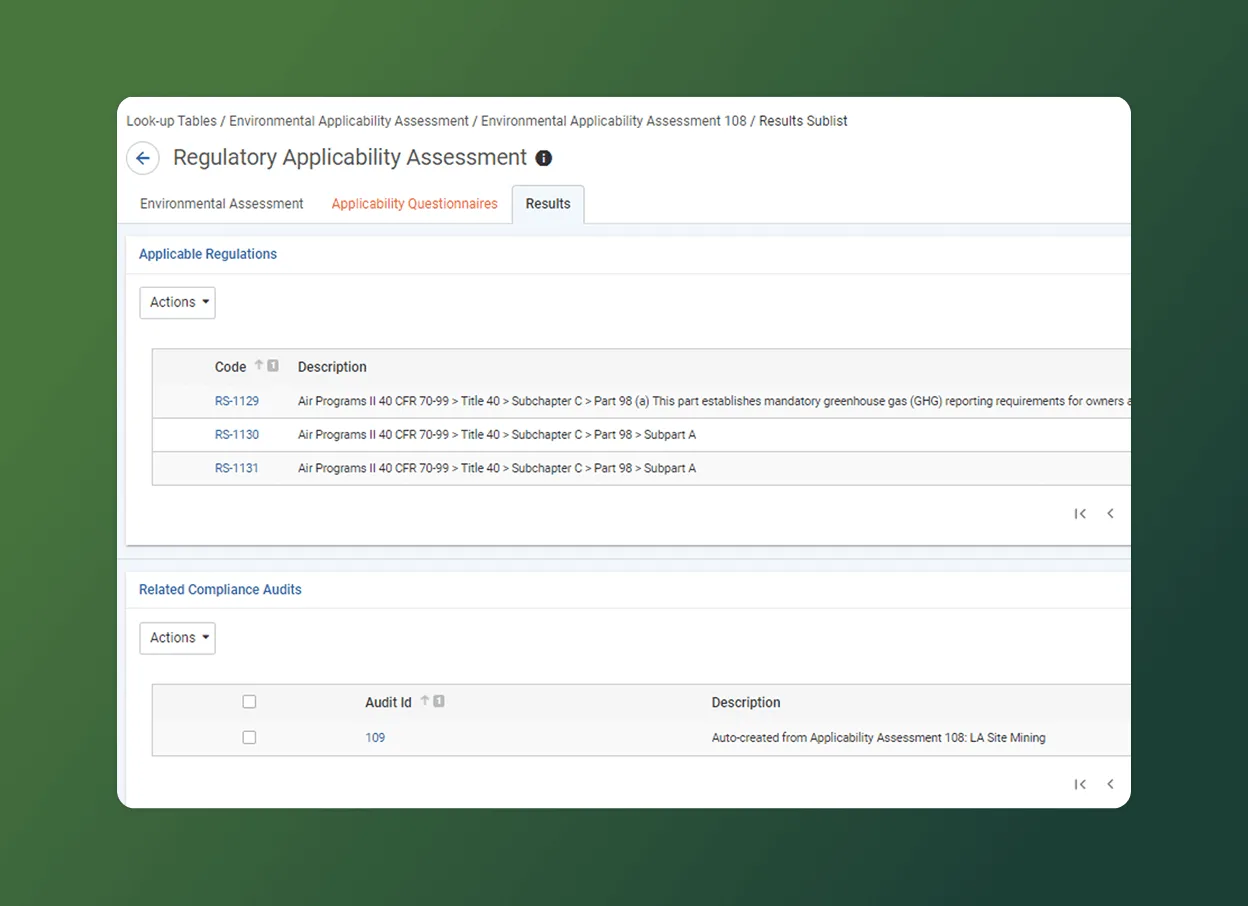
Automate compliance tasks
Track obligations easily
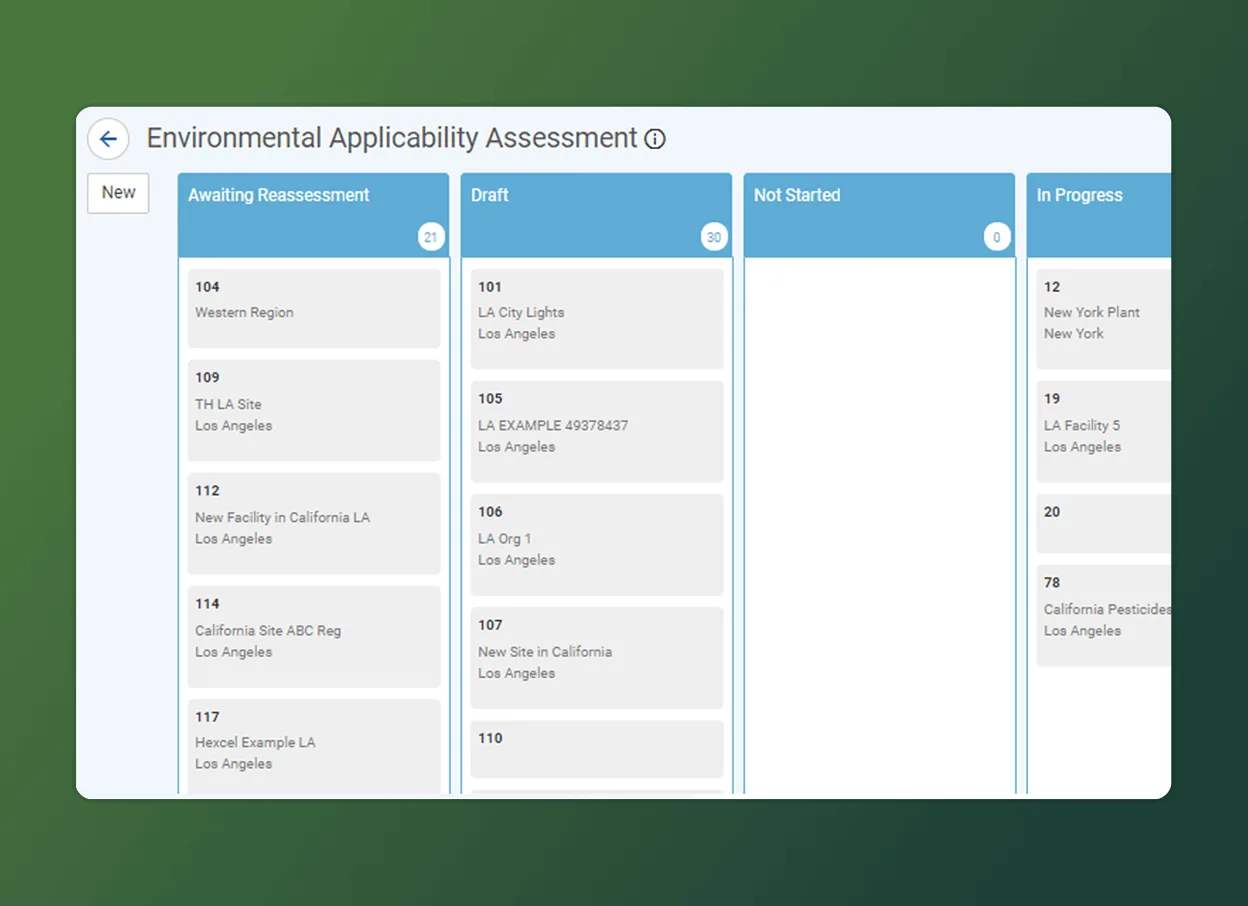
Close gaps quickly


Cority Launches in Saudi Arabia to Support Safer, Smarter Operations Aligned with Vision 2030
Trusted AI-powered EHS solutions help organizations manage risk, protect workers, and meet rising regulatory demands across the Kingdom Toronto, ON
Cority and 3E Partnership Wins Environmental Protection New Product of the Year
Cority’s Enhanced Chemical Management Wins Two Top Industry Awards Toronto, ON — Cority, a leading provider of enterprise Environmental, Health,
Cority Partners with ACGIH to Provide More Scientifically-Derived Occupational and Industrial Hygiene Threshold Data
Collaboration enables insights to reduce workplace risk and exposures Toronto, ON, June 16, 2022 – Industrial hygienists are responsible for